Technology
Satellites Tame Fire Risk on Aussie Solar Farm
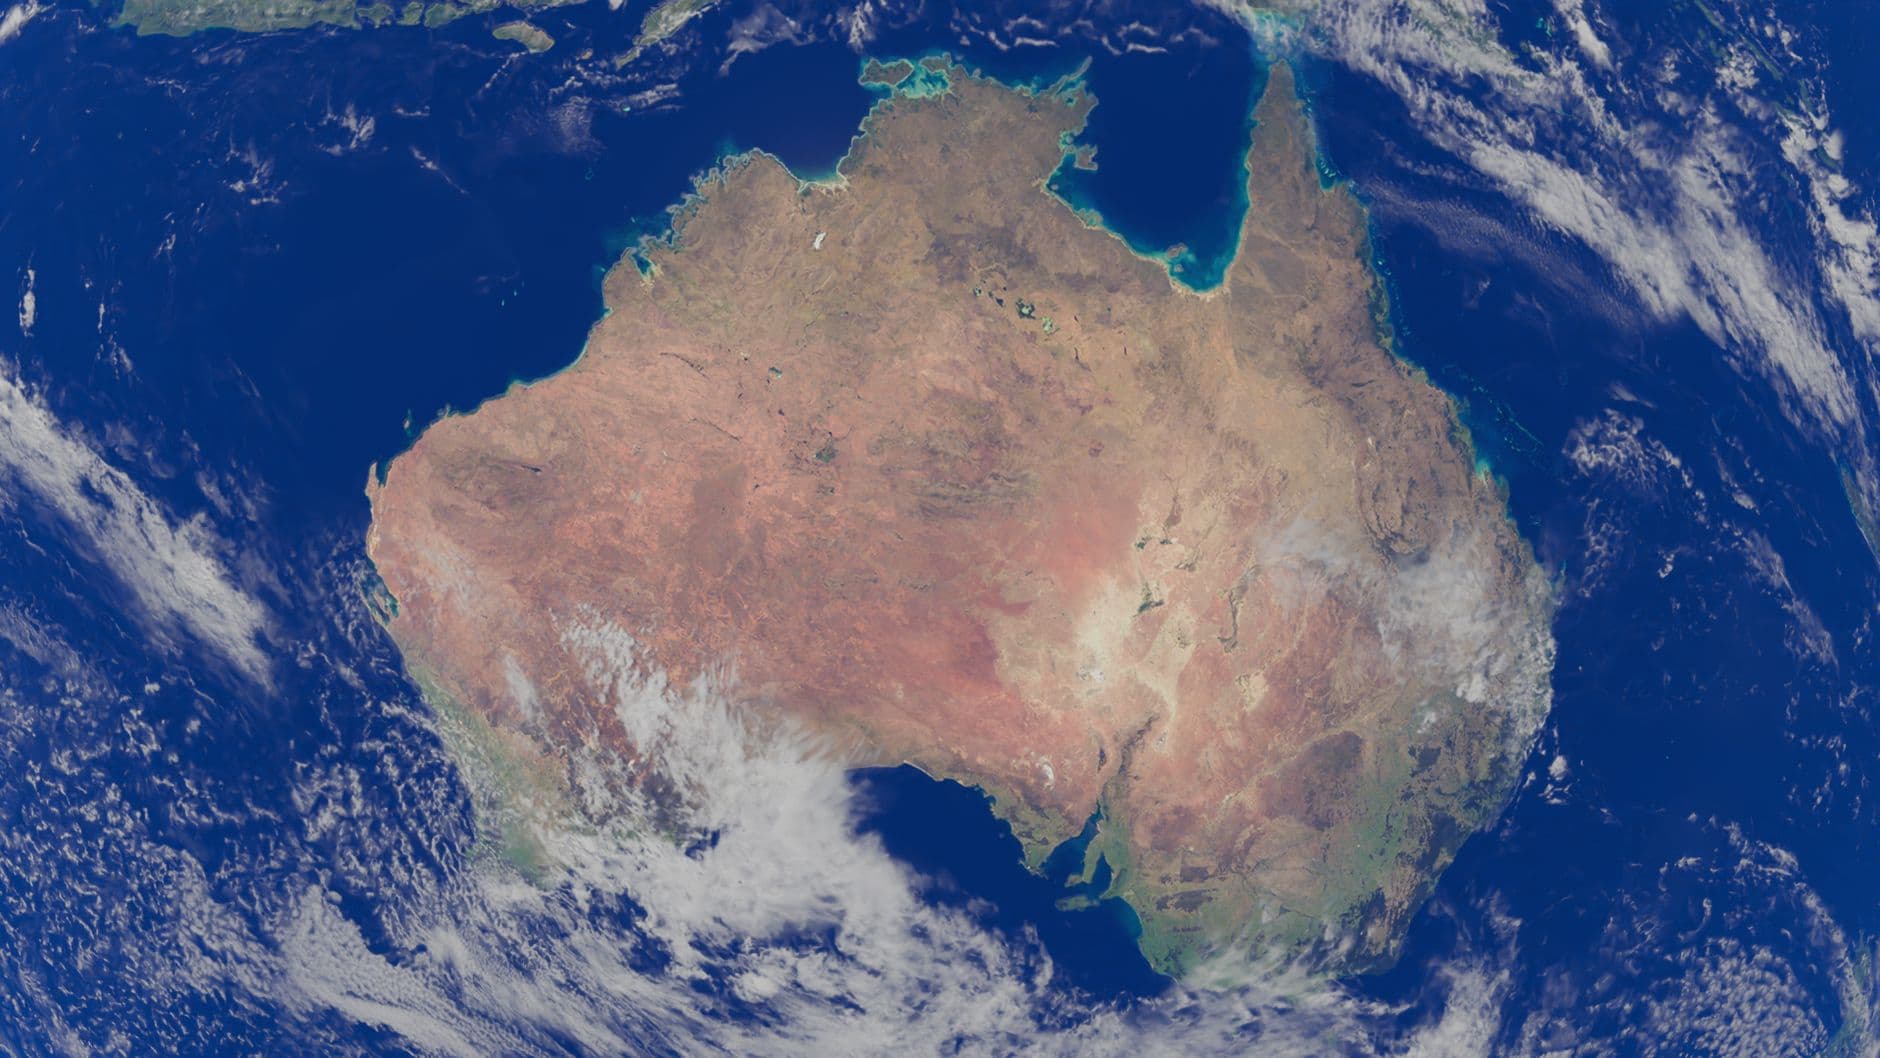
Satellite imaging gives a live fire‑risk map for New England Solar Farm
The New England Solar Farm in northern New South Wales now has a quantitative, satellite‑driven fire‑risk map that updates regularly. Researchers from CSIRO and Macquarie University feed hyperspectral data from Germany’s EnMAP satellite into AI models, turning grass height, moisture and biomass into a risk score that tells the operator where fire‑prone fuel is accumulating. This replaces the old manual walk‑around inspections and lets the farm’s 6,000 grazing sheep be managed safely under 720 MW of panels.
AI and hyperspectral data turn grass into numbers
By analysing the spectral signature of each square metre, the system can distinguish moist, low‑risk grass from dry, highly flammable fuel. CSIRO principal research scientist Cindy Ong explains that the biochemical detail lets the operator see how biomass is distributed around critical assets such as transformers and cabling. The AI then produces a numeric fire‑risk index that can be over‑laid on a map, highlighting zones that need grazing or mechanical slashing. According to Energy Magazine, PhD student Nona Sepahrom says the approach is “a new quantitative, repeatable system using satellites, airborne data, and field measurements to map vegetation fire risk across the entire site – and update it regularly.”
Balancing grazing, fire safety and solar output
The 2,000‑hectare site hosts more than 6,000 sheep, roughly three animals per hectare, a density that keeps the grass short enough to reduce fire fuel while still providing a viable agricultural income. The 400 MW first stage, operational since 2023, and the upcoming 320 MW second stage are both protected by a 200 MW/400 MWh battery that can store about two hours of generation, giving operators a buffer to shut down panels in an emergency. Gallagher Insurance notes that “comprehensive risk management for solar farms now includes remote‑sensing fire‑hazard assessments” (Gallagher Insurance). The new system therefore aligns three goals: (1) keep the fire risk low, (2) maintain high solar availability, and (3) preserve the farm’s grazing revenue.
What it means for Israel
Israel’s solar sector can borrow this playbook. A typical 10 kWp rooftop system in central Israel yields about 17,000 kWh per year, worth roughly ₪8,160 at the residential tariff of ₪0.48 /kWh, and pays back in about 3.9 years on a ₪31,500 install cost. If a 10 MW agrivoltaic farm were to adopt the same satellite‑AI workflow, the same principle applies: continuous, data‑driven monitoring would let owners spot dry vegetation before it ignites, schedule targeted grazing or mowing, and avoid costly shutdowns. Using Israel’s typical yield of 1,700 kWh/kWp·yr, a 10 MW array would generate around 17 GWh annually – enough to power tens of thousands of homes – and a fire‑risk‑reduction system could protect that value from the increasing bush‑fire‑like threats seen in the Negev. Operators could feed EnMAP‑style data into local AI platforms, leveraging the same quantitative risk scores that CSIRO uses, thereby extending the economic life of assets and supporting rural land‑stewardship.
Future outlook for solar‑agri integration
The New England project demonstrates that high‑capacity solar farms can coexist with productive agriculture when advanced remote sensing is applied. As climate change intensifies fire seasons across Australia – documented in a 24‑year Queensland study that shows a clear upward trend in fire frequency and severity (IOPscience) – the need for repeatable, satellite‑based risk models will only grow. CSIRO’s National Bushfire Intelligence Capability already integrates such data into national fire‑management planning (CSIRO NBIC Fact Sheet), suggesting that similar frameworks could be rolled out to solar farms worldwide, from the arid outbacks of Australia to Israel’s desert‑edge installations.
How you can see the technology in action
For larger developers, the EnMAP‑type hyperspectral data is becoming commercially available, and AI platforms can ingest it to produce daily fire‑risk dashboards. Check out our solar ROI calculator and the latest market data on solar installations to see how these tools could improve your own project's safety and profitability.
Sources & further reading
- First-of-its-kind research balances the needs of solar farms and grazing - Energy Magazine
- National Bushfire Intelligence Capability - CSIRO Research
- Climate-driven fire regime transformation in Queensland: a 24-year multi-seasonal assessment using satellite remote sensing (2001–2024) - IOPscience
- SECURING SOLAR FARMS FROM WILDFIRE THREATS AND FIRE HAZARDS Energy
- Satellite remote sensing of active fires: History and current status, applications and future requirements | US Forest Service Research and Development
FAQ
How does satellite imagery detect fire risk on a solar farm?
Hyperspectral sensors read the chemical signature of vegetation, letting AI separate moist grass from dry, flammable fuel and assign a numeric fire‑risk score to each area.
Why are sheep kept under solar panels?
Grazing keeps the grass short, reducing fuel load, while the panels provide shade that improves animal comfort and creates extra income for the landowner.
What is the size of the New England Solar Farm?
The project will total 720 MW of solar capacity on 2,000 ha, with a 400 MW first stage already operating and a 200 MW/400 MWh battery storage system.
Can Israeli solar farms use the same technology?
Yes – the same satellite‑AI workflow can map vegetation risk on Israeli arrays, helping owners avoid fire damage and schedule grazing or mowing efficiently.
How much electricity does a typical Israeli rooftop system produce?
A 10 kWp home system in central Israel yields about 17,000 kWh per year, enough to cover roughly 30 % of an average household’s electricity use.
Share this post
More from Technology
6
Floating Solar Tracker Boosts Yield by 20%
Noria Energy’s Airon floating‑solar tracker promises up to 20 % more electricity than fixed‑tilt FPV systems at similar cost, with commercial shipments slated for mid‑2027.
Israel’s Food Giant Goes 100% Green Power
Osem Nestlé has become the first Israeli food‑industry company to run entirely on renewable electricity, showcasing how solar power and green contracts can cut costs and emissions.

Silicon Solar Panels Slash Space Power Costs
Source Energy’s silicon solar modules can be built for under $5 per watt, slashing space‑power costs and opening new opportunities for Israeli satellite firms.
Array Tech Triples US Tracker Capacity
Array Technologies opened a $50 million Albuquerque factory that triples its U.S. solar‑tracker capacity, creates 300 jobs and could help lower tracker prices for Israeli rooftop installations.

Inclusion Fuels Solar Growth in Europe
Hanna König says inclusive, safe‑to‑disagree workplaces are essential to close the solar sector’s talent gap and accelerate the energy transition.
Super El Niño Slashes South Solar, Boosts North
Super El Niño 2026 created a pronounced north‑south solar split in South America, with sunnier conditions in the north and reduced irradiance in the south, while rare Atacama snowstorms threatened desert PV output.