Markets
China Solar Capacity Overtakes Coal
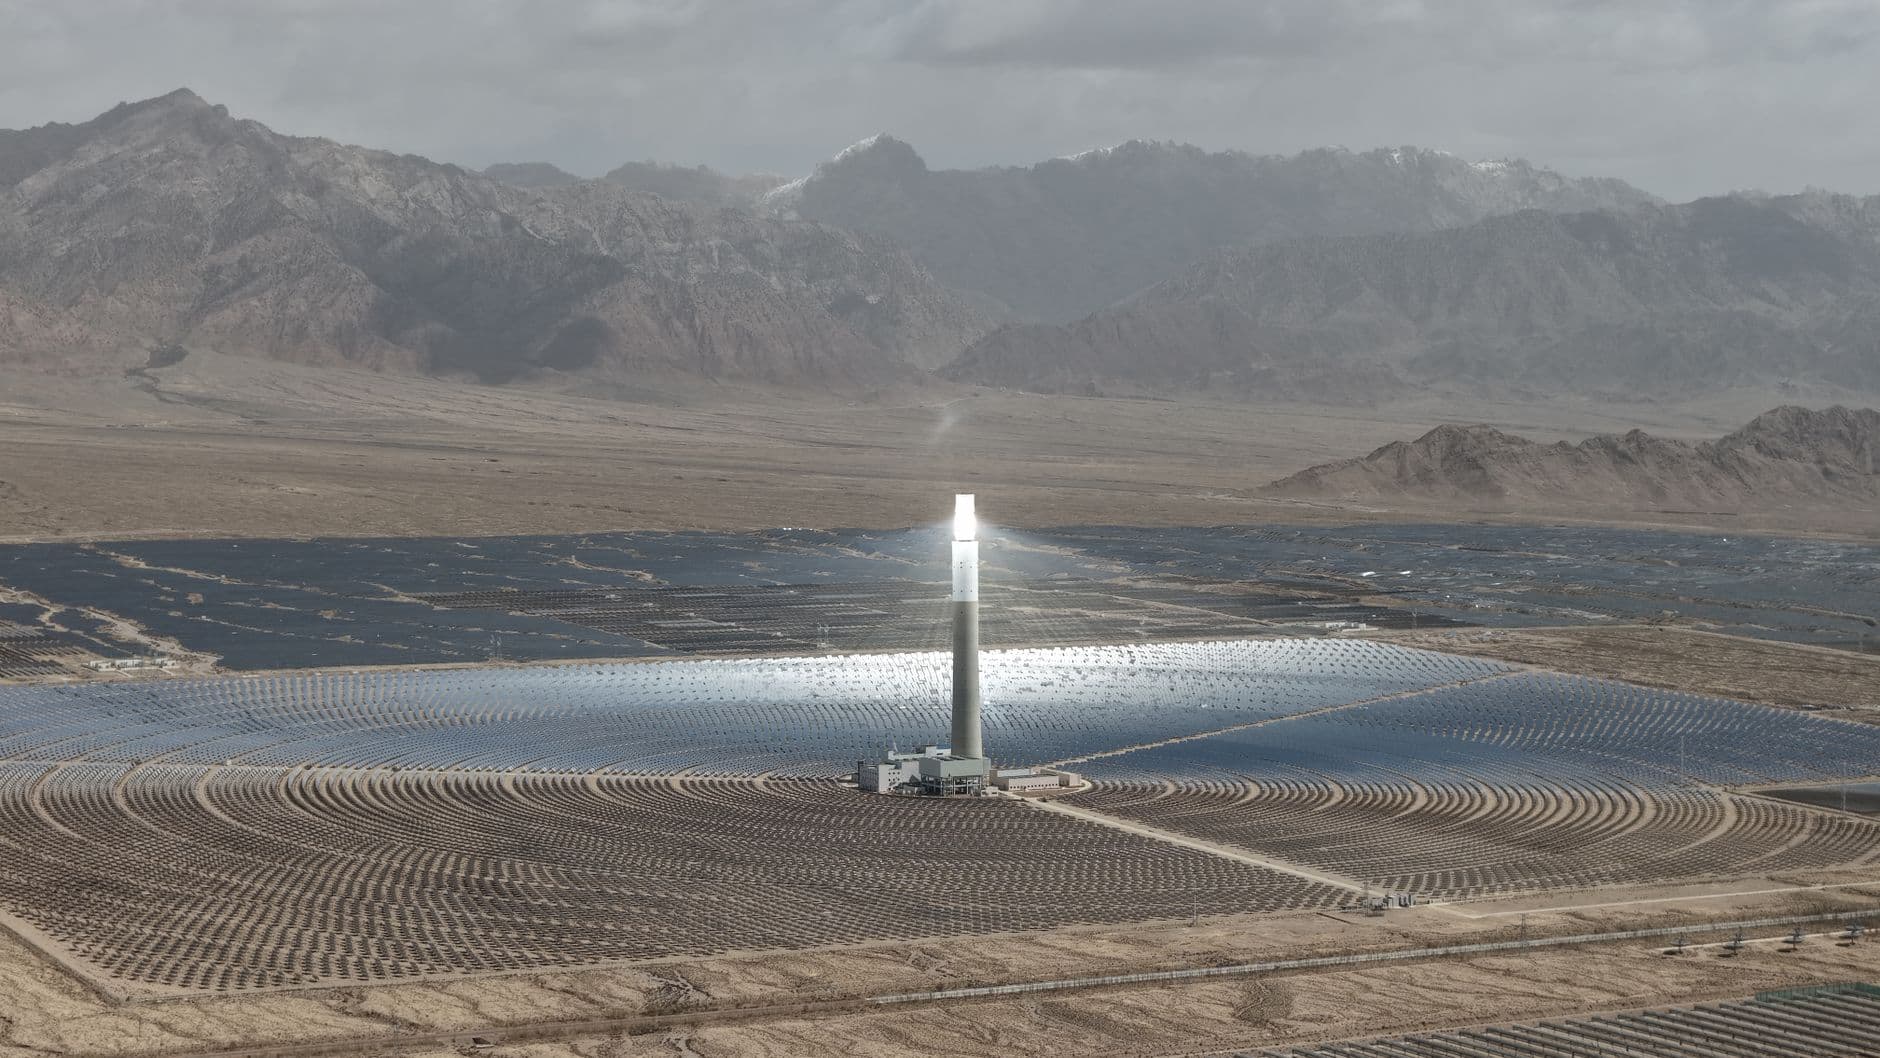
Solar capacity now bigger than coal in China
China’s cumulative photovoltaic (PV) capacity reached 1.286 TW at the end of July, nudging past the country’s approximately 1.285 TW of coal‑fired capacity for the first time ever. That means solar now accounts for around 31.5 % of China’s total installed power capacity, according to the National Energy Administration (NEA). The milestone is a clear break with a century‑long dominance of coal by installed capacity.
How fast the PV fleet grew since 2013
In 2013 China’s PV fleet was a modest 17.45 GW, just about 1.4 % of total generation capacity. Since then it has expanded dramatically to around 1.2 TW by the end of July, outpacing coal, wind, hydro and nuclear combined. The growth curve accelerated after the 2020 carbon‑neutral pledge: 77.4 GW in 2016, 130 GW in 2017, 250 GW in 2020, 609 GW in 2023 and 887 GW in 2024. International Renewable Energy Agency (IRENA) data show that China now holds roughly half of global solar capacity, which stood at about 2.4 TW at the end of 2025.
Why the surge is slowing – grid and market constraints
Despite the historic size, new installations are already falling. China installed about 71.8 GW of PV in the first half of 2026, a decline of roughly 66 % from the same period in 2025, when developers rushed to finish projects before a shift to market‑based renewable pricing. Grid‑integration bottlenecks are tightening: the average PV utilization rate slipped to 91.4 % in H1 2026 from 94 % a year earlier, prompting calls for more transmission, storage and flexible market mechanisms. Polysilicon output fell 9.8 % YoY and module production dropped 35.1 %, reflecting a sector‑wide “deep adjustment”.
Global impact of China’s solar dominance
China’s solar output in the first seven months of 2026 was 802.4 TWh, about 13 % of national electricity consumption, while coal still generated 2.5 PWh (≈ 49.7 % of total generation). The disparity between installed capacity and actual generation underscores the intermittency challenge. Officials at the China Electricity Council warned that without storage and grid‑forming technologies, coal will remain a crucial backup for years to come.
What it means for Israel
Israel’s power system is much smaller than China’s solar fleet, illustrating how quickly solar can become mainstream. A typical 10 kWp rooftop system in central Israel yields ≈ 17,000 kWh/yr, worth ≈ ₪8,160 at the residential tariff of ₪0.48/kWh. With a turnkey cost of ₪3,150/kWp, the payback period is ≈ 3.9 years, well before the 25‑year system life. Replicating even a modest share of China’s solar capacity would require millions of such home systems and could offset a noticeable portion of national electricity demand while reducing CO₂ emissions. Tools like our solar ROI calculator and market data can help investors gauge the economics of scaling up.
The next phase for China will be less about adding gigawatts and more about turning that capacity into reliable, dispatchable power – a challenge that also shapes Israel’s own renewable roadmap.
FAQ
When did solar capacity surpass coal in China?
China’s PV capacity edged past coal at the end of July 2024, reaching 1.286 TW versus 1.285 TW of coal.
What share of China’s total power mix is solar now?
Solar accounts for about **31.5 %** of all installed generation capacity in China.
Why are new solar installations falling in China?
Tighter grid‑connection rules, a shift to market‑based pricing and excess module supply cut new builds by roughly two‑thirds in the first half of 2024.
How does China’s solar size compare to Israel’s whole power system?
China’s 1.286 TW of solar is roughly **99 times** larger than Israel’s total installed capacity of about 13 GW.
What is the typical payback time for a 10 kWp home system in Israel?
At a residential tariff of ₪0.48/kWh and a cost of ₪3,150/kWp, a 10 kWp system pays back in about **3.9 years**.
Share this post
More from Markets
6
South Korea to Add 3.5 GW Solar in 2026
South Korea will install about 3.5 GW of new solar capacity in 2026, surpassing the 3.1 GW added in 2025, as part of a broader push that includes community‑solar villages and line‑side storage.

US Tariffs Push Solar Module Prices Up
U.S. Section 232 tariffs are expected to modestly raise solar module prices, adding a small extra cost to Israeli rooftop systems and slightly extending payback times.

Tongwei Clears Antitrust Hurdle for Lihao Deal
Tongwei has received antitrust clearance to acquire Qinghai Lihao, a fast‑growing polysilicon producer, paving the way for expanded low‑carbon silicon capacity that could help lower solar‑module prices worldwide.
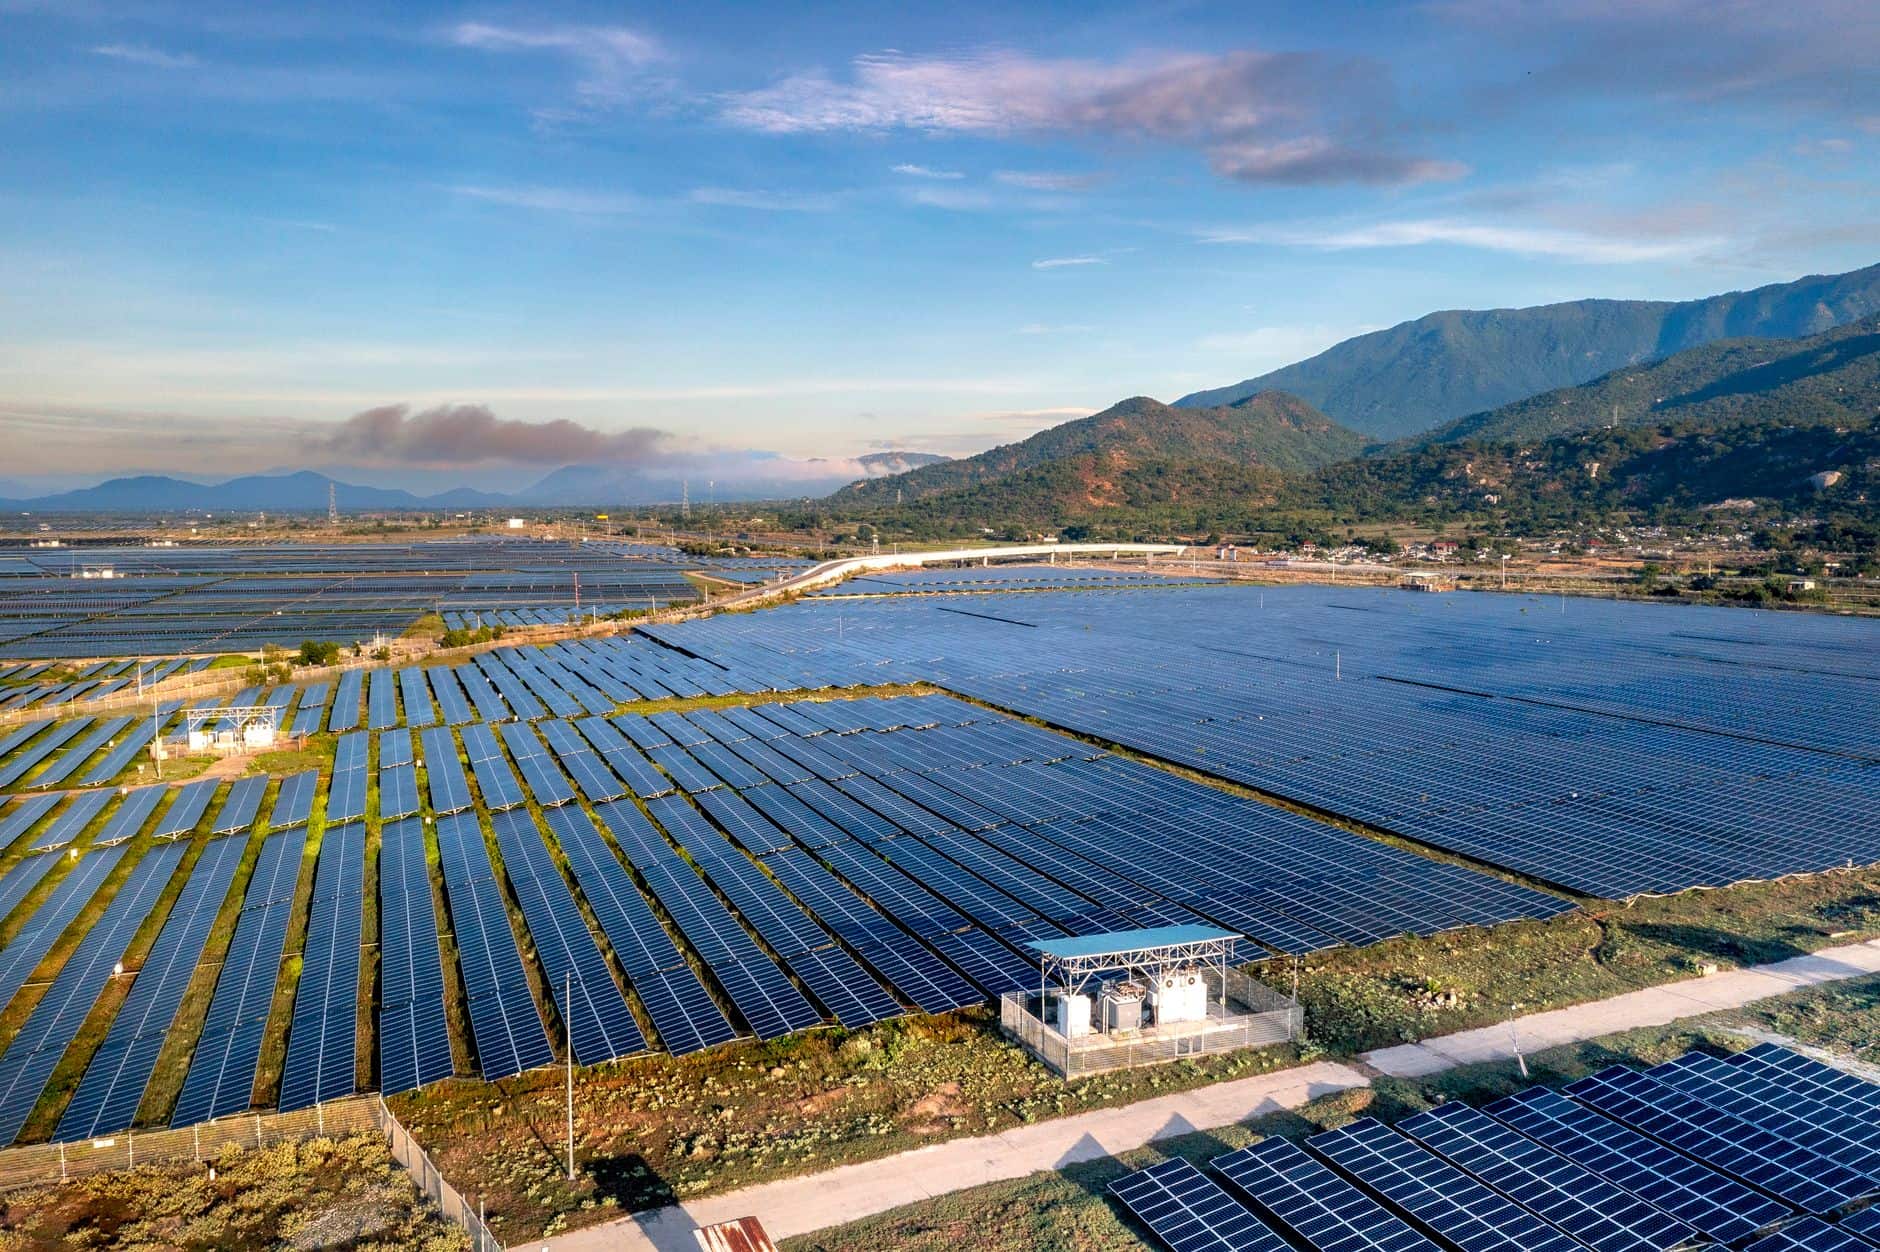
US Solar Adds 19.2 GW in H1 2026
The United States installed 19.2 GW of solar PV in the first half of 2026, driven mainly by a 61 % surge in utility‑scale projects, while residential solar slipped and permitting bottlenecks loom.
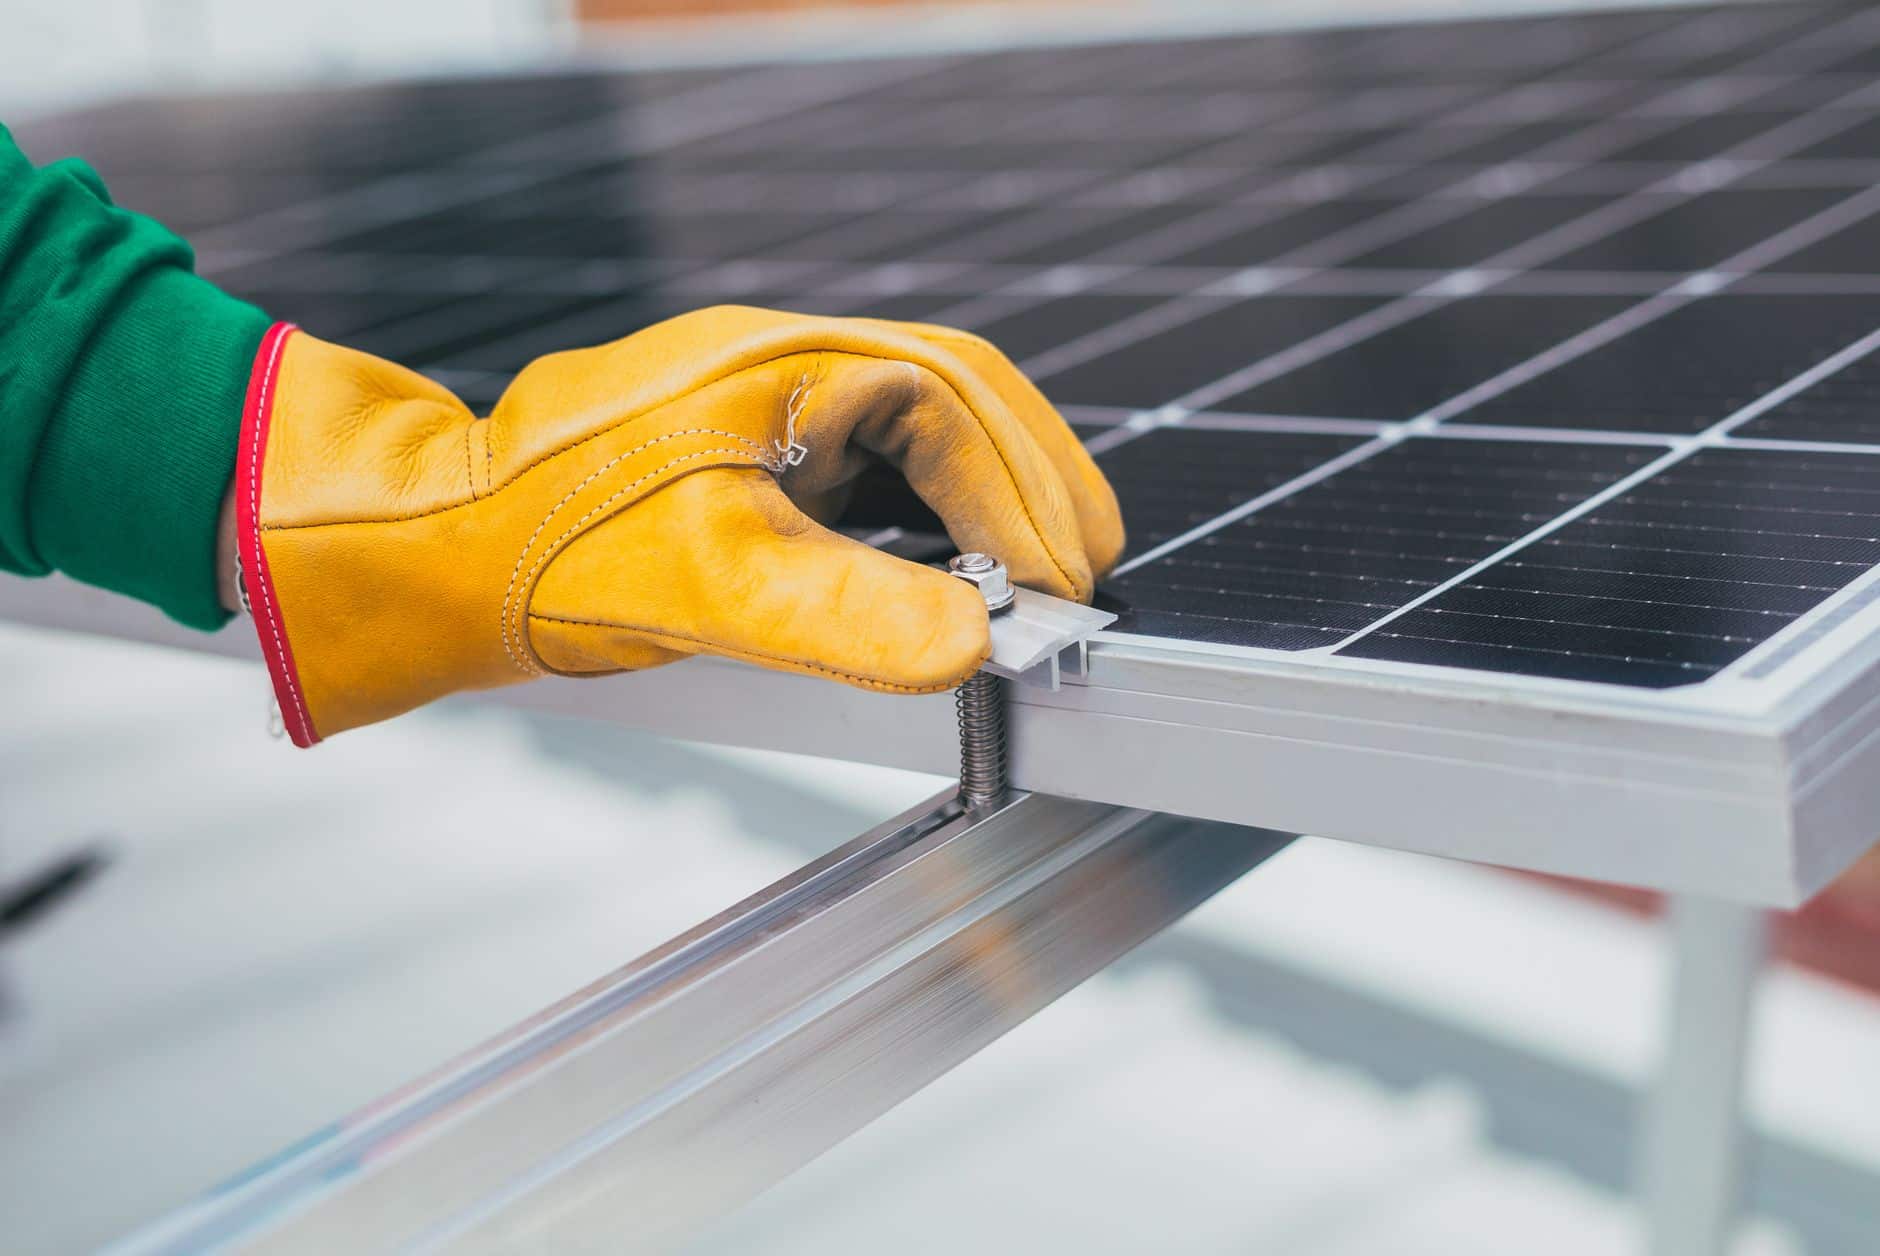
Chile’s Solar Curtailment Hits Record, Storage Ramps Up
Chile curtailed a record 2,680 GWh of solar and wind power in the first seven months of 2026, while battery storage capacity surged to over 2.6 GW, highlighting a growing flexibility gap.

Hormuz Crisis Sends Oil Prices 20% Higher
The Hormuz crisis has cut about 9 million barrels per day of oil, pushing Brent up 20 % and gas prices 40‑60 % higher, while making rooftop solar in Israel financially more attractive than ever.